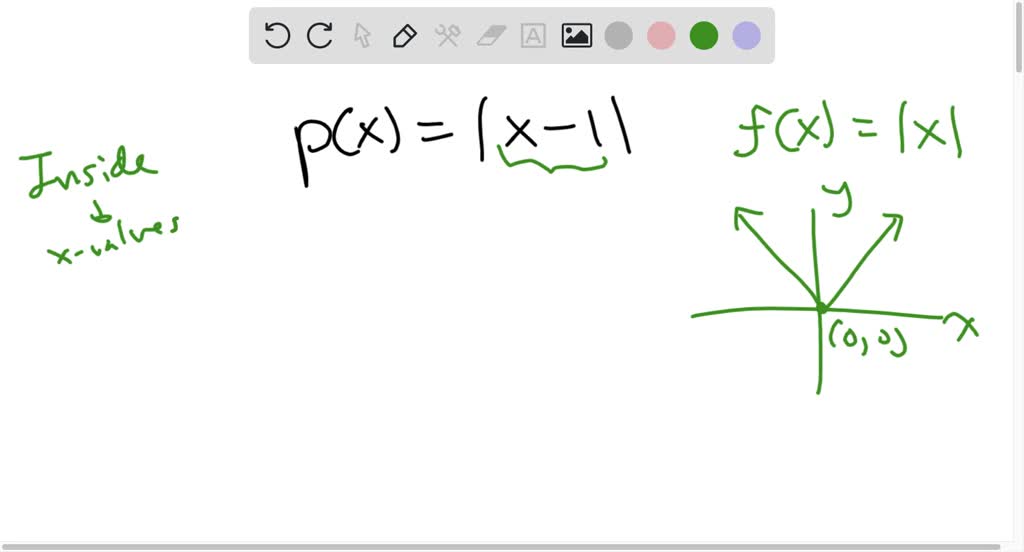
Exploring the Graphs of the Function p(x) = |x – 1|
Understanding the behavior and representation of mathematical functions is a fundamental aspect of mathematics. In this article, we will delve into the graph of the function p(x) = |x – 1| and analyze its properties and characteristics. Through a comprehensive exploration of different graph representations, we aim to provide a clear understanding of how this function is graphed and how it behaves.
Graph represents the function p(x) = |x – 1|
I. Definition and Interpretation of p(x) = |x – 1|:
The function p(x) = |x – 1| represents the absolute value of the expression (x – 1).
Absolute value refers to the magnitude of a number, disregarding its sign.
In the context of this function, we are interested in examining how the absolute value of the difference between x and 1 influences the output values of p(x).
II. Graphical Representation of p(x) = |x – 1|:
To better understand the graph of p(x) = |x – 1|, let's explore the following key aspects:
1. x-intercept: The x-intercept occurs when p(x) equals zero. By setting |x – 1| = 0, we find that x = 1. Therefore, the graph intersects the x-axis at x = 1.
2. Symmetry: The function p(x) = |x – 1| exhibits symmetry with respect to the vertical line x = 1. This means that for any value of x, the corresponding value of p(x) will be the same distance from the line x = 1, regardless of whether x is greater or less than 1.
3. Behavior for x < 1: When x is less than 1, the expression inside the absolute value bars, (x – 1), becomes negative. Therefore, p(x) = -(x – 1) = 1 - x. Consequently, for x values less than 1, p(x) will be equal to the positive difference between 1 and x.
4. Behavior for x > 1: For x values greater than 1, the expression inside the absolute value bars, (x – 1), is positive. Hence, p(x) = |x – 1| = x - 1. In this case, p(x) will be equal to the difference between x and 1.
5. V-shape Graph: Combining the behaviors described above, the graph of p(x) = |x – 1| exhibits a V-shape. The vertex of the V is located at the point (1, 0), representing the x-intercept.
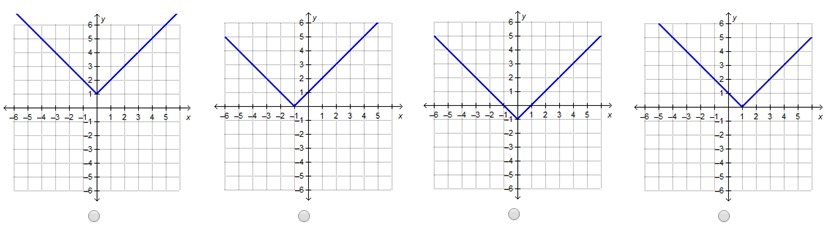
Graph represents the function p(x) = |x – 1|
III. Different Graph Representations:
Now, let's explore different graph representations that can effectively depict the function p(x) = |x – 1|. Visualizing the graph assists in comprehending its characteristics and further analysis.
1. Cartesian Coordinate System:
The Cartesian coordinate system, also known as the rectangular coordinate system, is commonly used to graph functions. Here, the x-axis represents the input values, while the y-axis represents the corresponding output values of p(x).
2. Number Line Representation:
Using a number line, we can plot the values of x and their corresponding p(x) values. This representation helps us visualize how the function changes as we move along the number line.
3. Desmos Graphing Calculator:
Desmos, an online graphing calculator, provides an interactive platform to graph functions. By inputting p(x) = |x – 1| into the Desmos calculator, we can observe the graph and explore its properties.
In conclusion, the function p(x) = |x – 1| represents the absolute value of the difference between x and 1. By analyzing its graph, we have discovered its key characteristics, such as symmetry, x-intercept, and V-shape. Understanding these properties helps us interpret the behavior of the function accurately. By utilizing different graph representations, such as the Cartesian coordinate system, number line, or graphing calculators like Desmos, we can further visualize and explore the intricacies of this function.