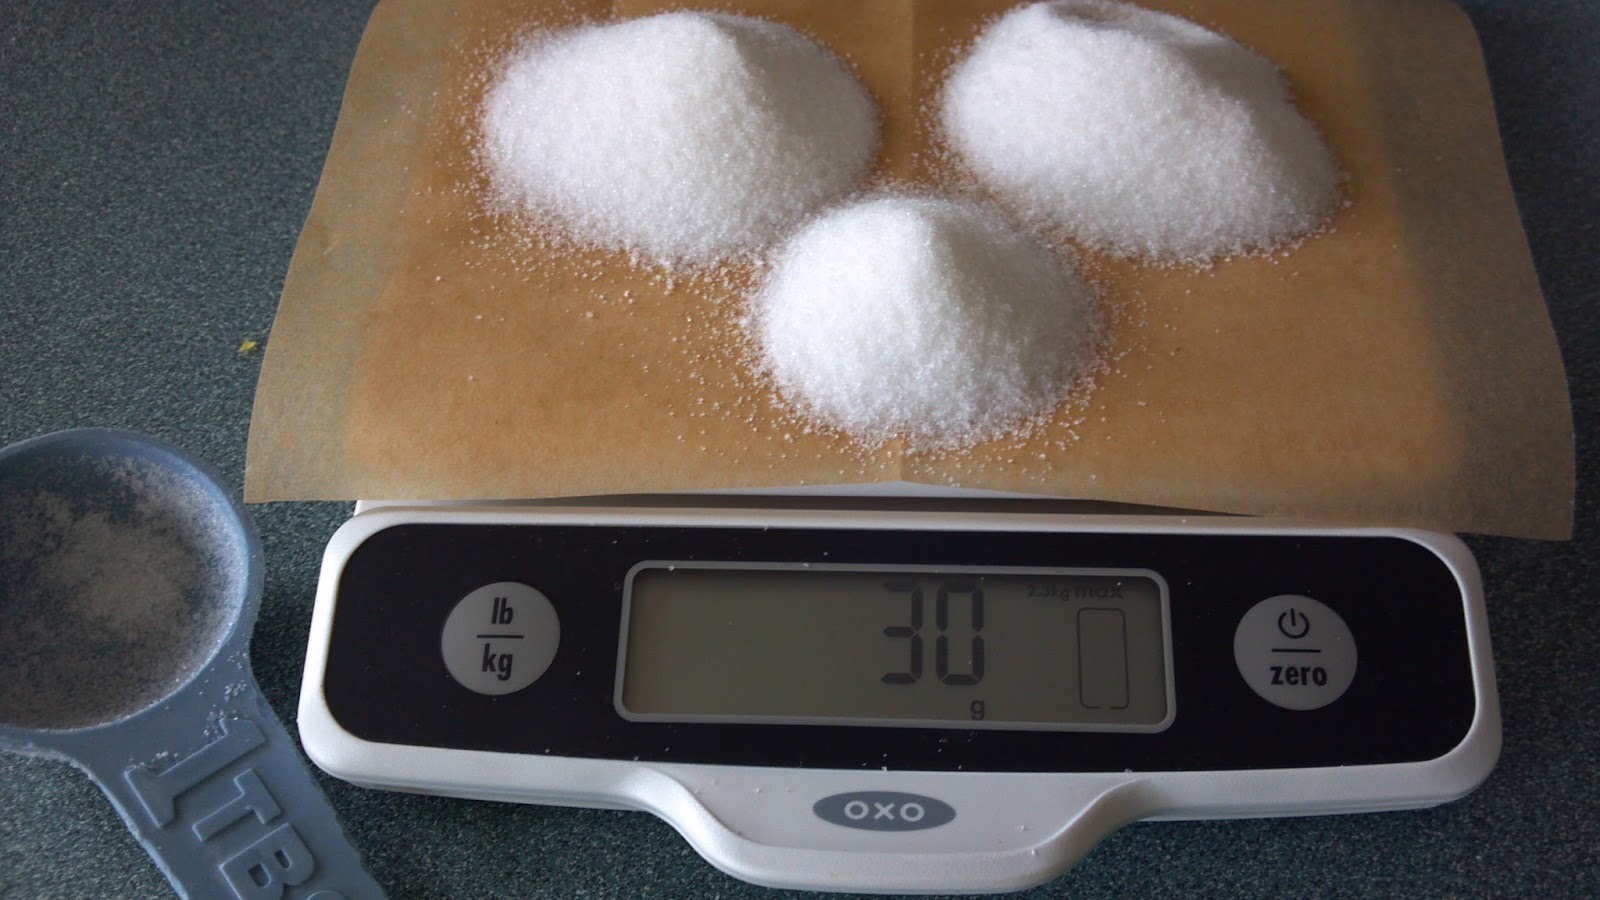
Exploring the Visual Impact of 30 Grams of Sugar
In an era where sugar consumption is at an all-time high, the question "What does 30 grams of sugar look like?" has become more relevant than ever before. The impact of sugar on our health and wellbeing cannot be understated, and understanding the visual representation of this amount can serve as a powerful tool for making informed dietary choices. This article delves into the concept of 30 grams of sugar, unraveling its implications and shedding light on its significance.
I. The Science Behind Sugar Intake
Before we explore the visual aspects, it's crucial to understand the science behind sugar intake. Sugar, in various forms, is present in many foods we consume daily. Be it natural sugars found in fruits or added sugars in processed foods, they all contribute to our overall sugar intake.
The recommended daily sugar intake is typically around 25 grams for women and 38 grams for men, as per the American Heart Association. However, these numbers are easily surpassed due to hidden sugars in unsuspecting foods.
II. Visualizing 30 Grams of Sugar
To truly grasp the impact of 30 grams of sugar, visual aids are indispensable. Imagine a standard sugar packet commonly served with a cup of coffee. Each packet contains about 4 grams of sugar. So, envision seven and a half of these sugar packets – that's 30 grams. Visualizing this can be a wakeup call, considering how effortlessly these sugars can accumulate through seemingly harmless choices.

30 Grams of Sugar
III. Comparisons to Everyday Objects
Drawing parallels to everyday objects can further highlight the magnitude of 30 grams of sugar. A regular can of soda contains approximately 39 grams of sugar – slightly exceeding the recommended daily intake.
Thus, envisioning almost the entirety of a can filled with sugar is a stark reminder of the sugar content we might unknowingly consume. Similarly, a standard chocolate bar often harbors around 25 grams of sugar, almost reaching the daily limit.
IV. Implications for Health
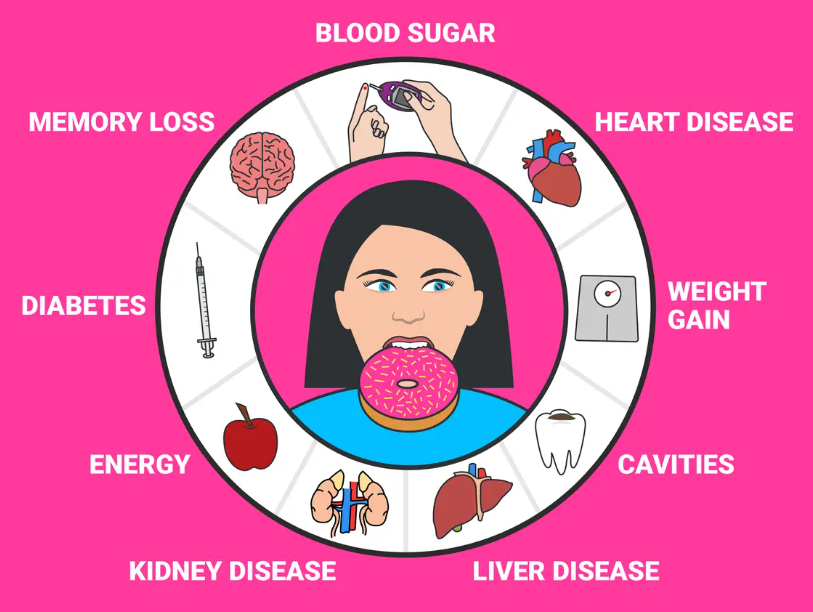
The excessive consumption of sugar has been linked to a plethora of health issues, ranging from obesity and type 2 diabetes to heart diseases. Visualizing 30 grams of sugar can serve as a sobering reminder of the potential consequences of unchecked sugar consumption. With obesity rates skyrocketing worldwide, understanding the tangible representation of sugar can encourage individuals to make healthier dietary decisions.

Implications for Health
V. Reading Nutritional Labels
Being conscious of sugar content necessitates reading nutritional labels diligently. Most food products are now required to list the grams of sugar per serving on their labels. Armed with the visual representation of 30 grams of sugar, deciphering these labels becomes easier. It empowers consumers to assess the sugar content more critically and make informed choices that align with their health goals.
VI. Educational Initiatives and Awareness
Promoting awareness about sugar consumption is essential, and visualizing 30 grams of sugar can be a pivotal tool in educational initiatives. Schools, community centers, and healthcare facilities can utilize this visual aid to educate people about the hidden sugars in various foods.
By fostering an understanding of portion sizes and their sugar content, these initiatives can contribute to the fight against rising sugar-related health issues.
VII. Conclusion
In conclusion, the question "What does 30 grams of sugar look like?" holds immense significance in our modern society plagued by excessive sugar consumption. The visual representation of this quantity serves as an eye-opening reminder of the sugar content in various foods.
By utilizing comparisons to everyday objects and encouraging critical examination of nutritional labels, individuals can take charge of their dietary choices. Through education and awareness, we can strive for a healthier future with reduced sugar-related health risks.