How to Find Class Width: A Comprehensive Guide
Understanding class width is essential in various statistical and data analysis tasks. Whether you're a student, researcher, or professional, having a solid grasp of class width allows you to effectively organize and analyze data. In this article, we will explore the concept of class width, its significance, and methods to calculate it accurately.
1. What is Class Width?
What is Class Width?
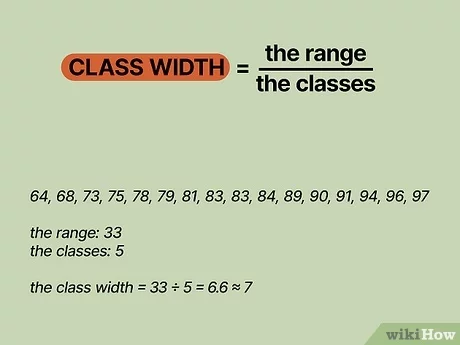
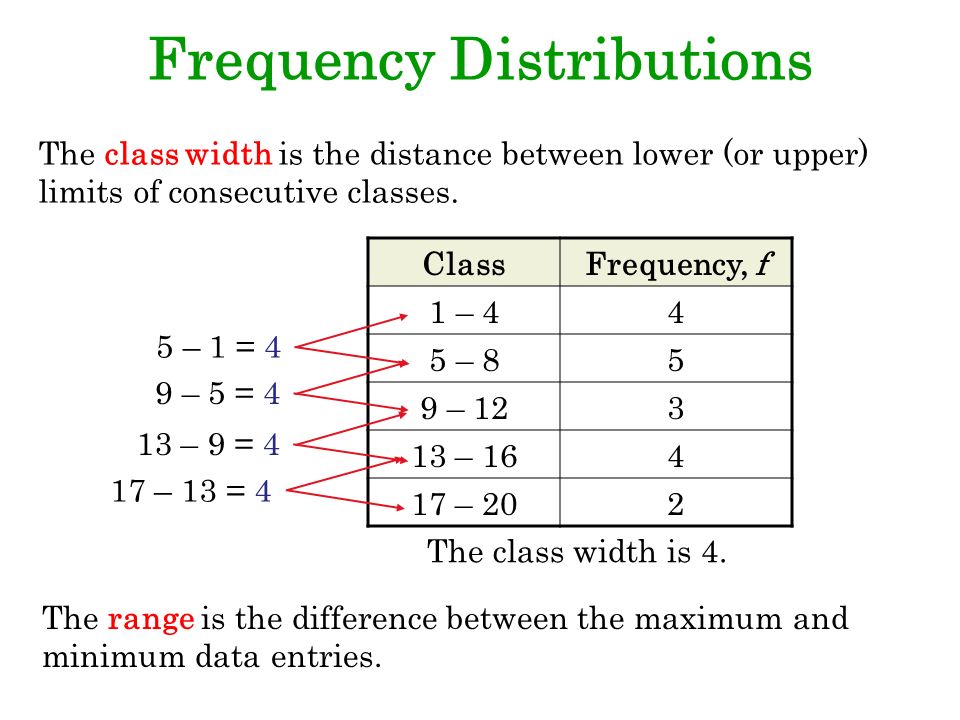
Class width refers to the range of values within each class or interval in a frequency distribution. It determines the width of the intervals in which data is grouped. Class width plays a crucial role in creating histograms, frequency polygons, and other graphical representations of data.
2. Importance of Class Width:
Importance of Class Width
Accurate determination of class width helps in presenting data in a meaningful and visually appealing manner. A well-chosen class width ensures that data points are evenly distributed across the classes, providing a balanced representation of the dataset. Additionally, an appropriate class width can reveal patterns, trends, and insights within the data.
3. Methods to Calculate Class Width:
There are different approaches to calculate class width. The choice of method depends on the nature of the data and the objectives of the analysis. Here are three commonly used methods:
a. Square Root Method: The square root method is a simple approach that uses the square root of the total number of observations to determine the class width. The formula for calculating class width using this method is:
Class Width = (Max Value - Min Value) / √(Number of Observations)
b. Rice Rule: The Rice Rule provides a guideline for selecting class width based on the number of data points. According to this rule, the class width should be approximately equal to 2 times the cube root of the number of observations.
c. Sturges' Formula: Sturges' formula is widely used when dealing with large datasets. It suggests that the number of classes (k) can be estimated using the formula:
k = 1 + 3.322 * log(N)
where N is the number of observations. Once the number of classes is determined, the class width can be calculated by dividing the range of values by the number of classes.
4. Example Calculation:
To illustrate the class width calculation, let's consider a dataset of 100 observations with values ranging from 10 to 90. Using the square root method, the class width would be:
Class Width = (90 - 10) / √(100) = 8
Thus, each class would have a width of 8 units.
5. Choosing the Optimal Class Width:
While these methods provide guidelines for calculating class width, it's important to consider the nature of the data and the objectives of the analysis. In some cases, adjusting the class width slightly may lead to a more informative representation of the data. Experimenting with different class widths and evaluating the resulting visualizations can help determine the optimal choice.
6. Visualizing Data with Class Width:
Once the class width is determined, it can be used to create histograms or frequency polygons. These graphical representations provide a visual summary of the data, highlighting its distribution and patterns. Choosing an appropriate class width ensures that the resulting visualizations are clear and insightful.
Understanding how to find class width is crucial for effectively organizing and analyzing data. By accurately determining class width, you can create informative visualizations and uncover valuable insights from your data. Remember to consider the nature of the data and experiment with different class widths to find the optimal choice. With this knowledge, you'll be well-equipped to tackle statistical analysis tasks with confidence.